Spectroscape User Manual with GIFs
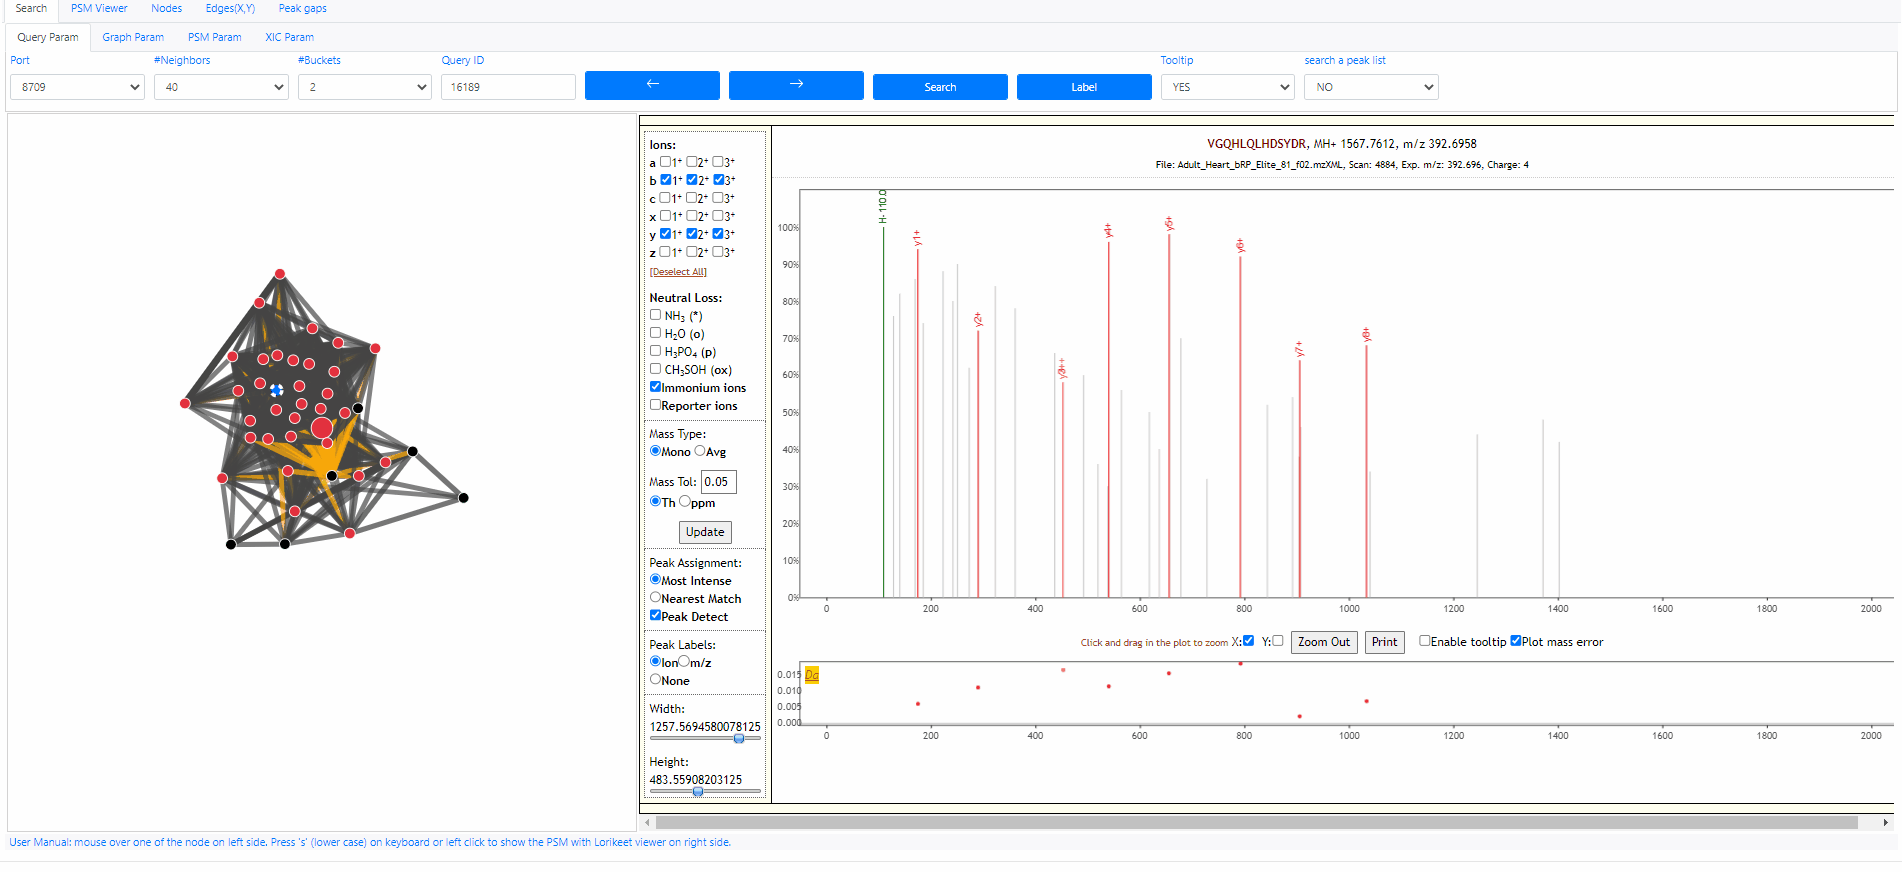
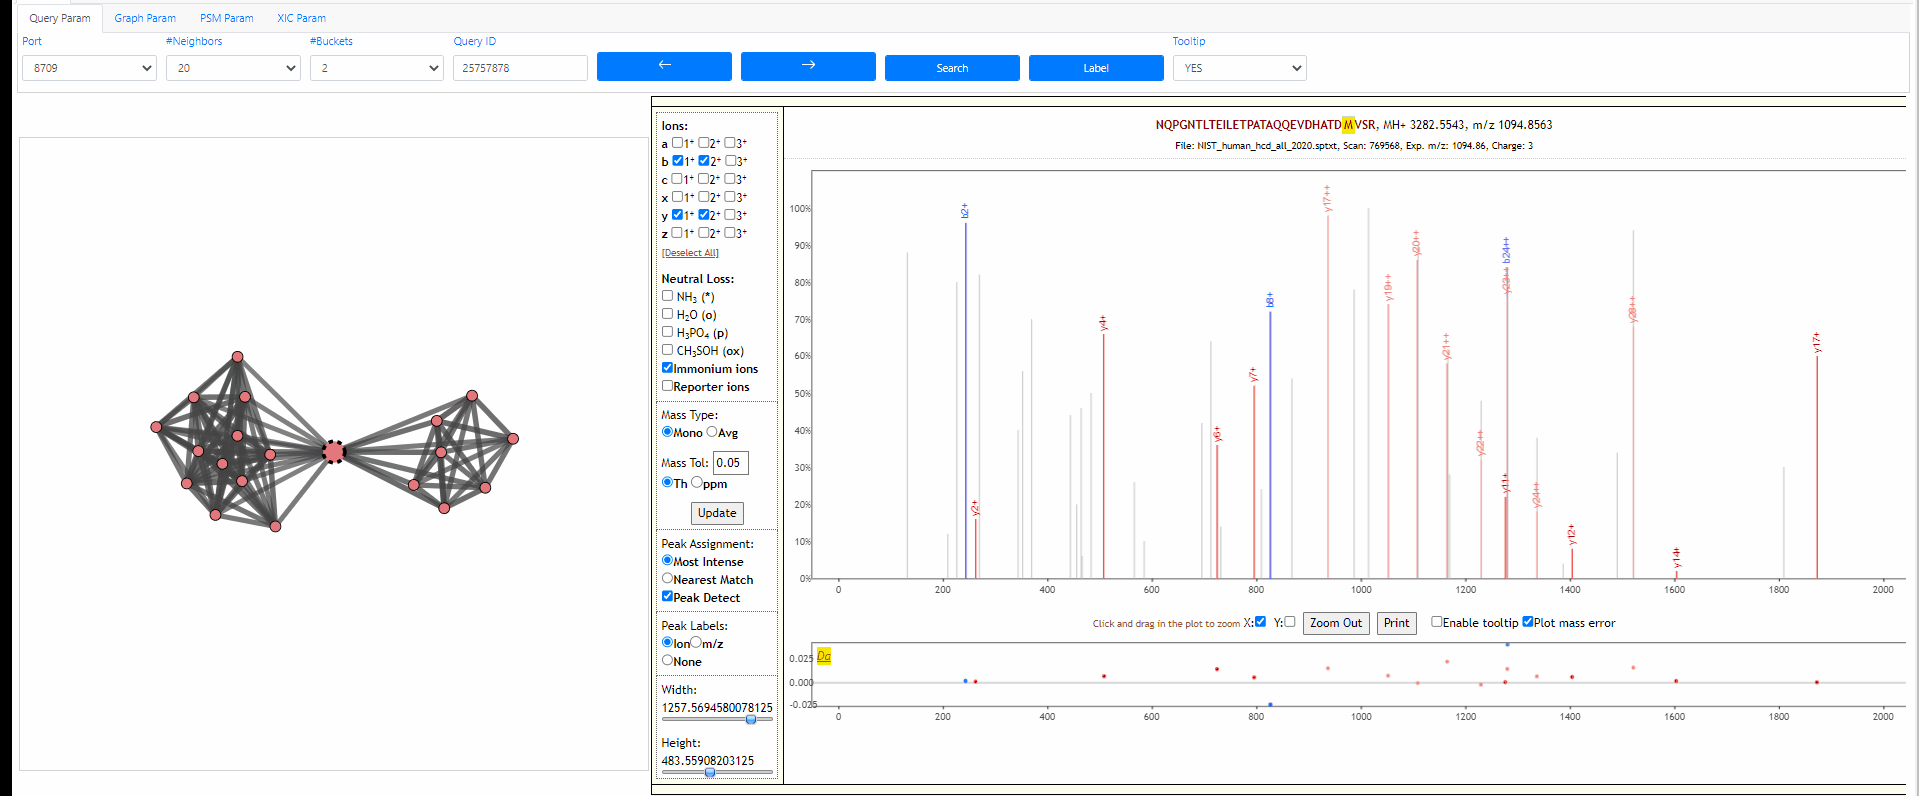
Search query
Each MS2 spectrum in the archive is designated with an identifier (id). The identifier ranges from 0 to size of the archive (exclusive). The following example shows how to search an query spectra from NIST library. The query id is 25757878.
Tooltip on node and edges, PSM visualization and search new query
Mouse over any node or edge to show the tooltip information. Single click on any node to show the PSM on the right side using Lorikeet. Double click on any node to start a new search using that node as query spectrum.
Tuning parameters of graph
Change the strength of repulsive force between nodes and the attractive force (gravity) to the center. Also adapt the width of edges.
Investigate unidentified PSM corresponding to semitryptic peptide
The following examples shows how to find the correct solution of an unidentified peptide. The query id is 18497303 . In this case, the query node is in black color which means it is not identified. However, there are many neighbors in red are identified as DDPLTNLNTAFDVAEK, and the highlighted edge suggests that the delta mass is 230Da, which equals to mass of "DD". So we can guess if we remove the DD from "DDPLTNLNTAFDVAEK", the remaining part "PLTNLNTAFDVAEK" will match to the query node. In the PSM viewer, we edit the peptide and click update button, and see it is a very good PSM. The user can send a message to the server to report this error.
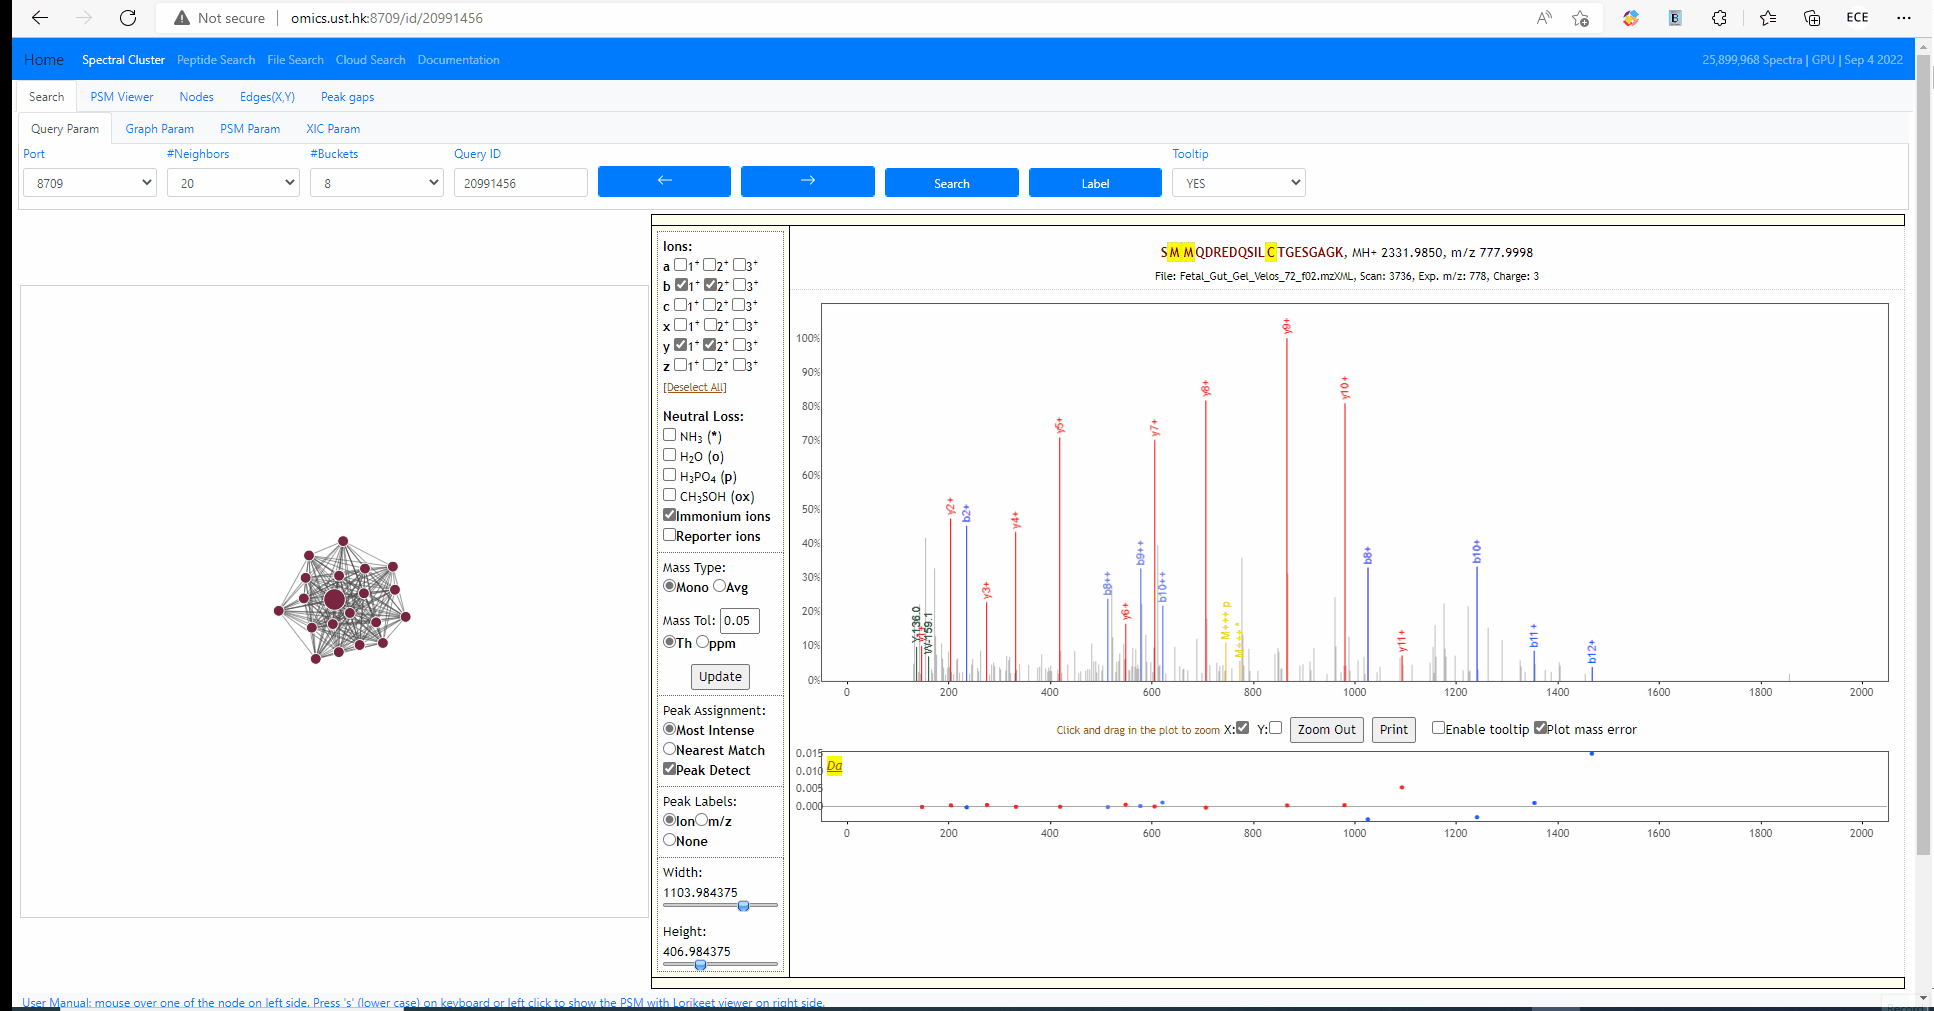
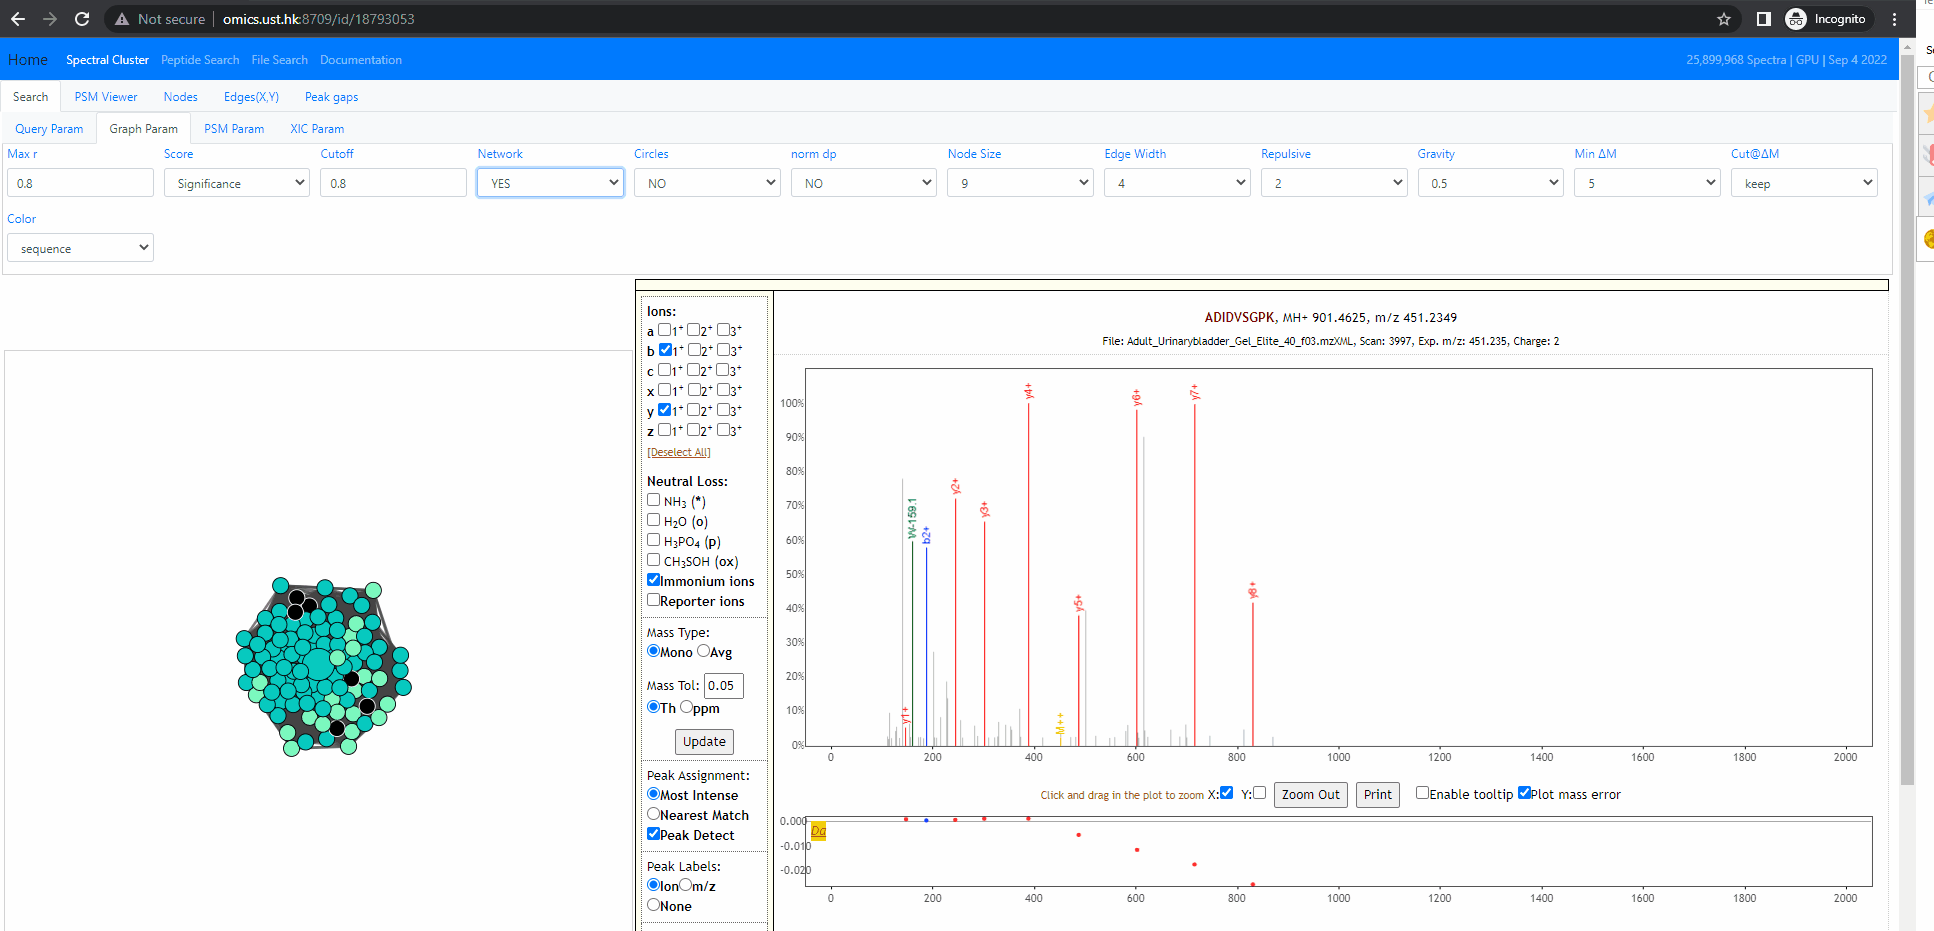
Investigate into mixture spectra of two similar peptides
The following example shows two similar peptides co-fragmented into one MS2 spectrum. The query id is 18793053 . In this case, the neighbors of the query node form one tightly connected cluster. All of them are identified, but as two different peptides, ADIDVSGPK and ADVDISGPK. Thse two peptides share many fragment ions. From the back-to-back PSM plot implemented in Spectroscape interface, one can clearly see the query spectra contains peaks of both peptides.
There are four different mode when it comes to the back-to-back plot: query, neighbor, separate and mixture. In the first three mode, the back-to-back plot shows two spectra, the top spectrum is the one user selected by single clicking on the neighbouring node, and the bottom one is the query spectrum. The query method will annotate the two spectrum with the peptide of query node. The neighbor method will annotate the two spectrum with the peptide of the user selected spectra. The separate method will annotate the two spectra with their own peptide. The last method, the mixture annotation will show top and bottom with the same query spectrum, but annotated with query peptide (bottom) and peptide of user selected node (top).
Search a peak list out of archive
It is possible to search a peak list out of the archive, the only information we need is a peak list. The peak list should contain multiple rows, each row is a pair of values, mz and intensity. Here is an example peak list.
120.058 48 156.100 35 175.113 39 201.114 50 207.095 36 214.054 38 229.099 43 258.122 32 298.131 31 303.105 30 312.169 25 333.135 23 362.188 46 379.156 26 425.238 21 433.234 45 438.178 22 441.169 28 466.163 29 496.284 27 566.293 18 583.322 47 596.292 42 682.383 41 759.350 37 765.423 16 783.429 49 873.396 33 893.477 19 894.453 34 911.482 44 974.441 24 1044.450 17 1058.549 20 1061.479 40 1145.586 15
This Peak list above actually is the query spectrum 21958751. Now we can open the Spectroscape web interface, choose to search a peak list, then we can paste the peaks above to the text box and click button "search peak list". It's done. The web interface will show the network between the query spectra and its neighbors. Note that this spectrum is out of the archive, therefore its query id become "-1".